In the hands of a dilettante, albeit an expert real estate developer, population change obfuscates more than it illuminates. If he has seen one population boom, he hasn't seen them all. Rural-to-urban migration brings with it a birth rate dividend. Those who would have been field hands crowd tenement buildings. Whereas the boom of suburban brats in urban chic may never yield children within city limits. Without immigration, the 1950s won't happen anywhere in the United States. The birth rates are too low.
When in doubt, dig into the data. Interrogating the struggling middle class in the Federal Reserve Bank's Ninth District:
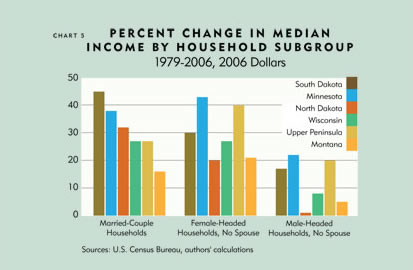
Here’s a simplistic example to illustrate the effect of household composition changes. Suppose there are 10 people (five men and five women) each making $34,000 per year, and together they make up six households: four married couples with household incomes of $68,000, one male- and one female-headed household, both with income of $34,000. The middle income observation for these six households is $68,000, the income of a typical married couple.
The next year, one of the married couples is divorced. That leaves three married households and four single-headed households—two headed by men and two headed by women. Now let’s say every person gets a 10 percent pay raise. Is everyone better off? You certainly could argue that. But because of the compositional shift, the median for these seven households plummets to $37,400 because the middle-ranked observation (with the raise) is now a single-headed household.
This example exaggerates the actual decline in married couples, but it demonstrates why the overall household median can be misleading. In the district, every state saw a decline in married households roughly in line with the national trend.
The "compositional shift" is just one example of how the median income metric (like population change) can distort our understanding of how the middle class is doing. Everyone gets a raise. The median income goes down. I see this mistake all the time in arguments about how to address affordable housing. Experts and dilettantes alike abuse the data to score ideological points. Misleading traps abound.
Remember rule 1: When in doubt, dig into the data. Rule number 2 concerns disaggregation. The Fed's Ninth District shows how:
Simply put, the Fed controls for the household compositional shift problem. What is good for median income is good for population, particularly in Rust Belt cities. Over long time periods, a household is anything but a constant. Don't be fooled.
No comments:
Post a Comment